Domain Activity
The Domain Activity section provides real-time connection statistics and performance chart of the domain. The information is shown in two tabs: Activity and Performance.
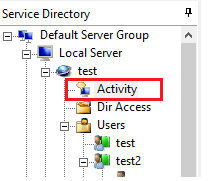
Click the Activity node under the domain to access the Domain Activity section.
Activity tab
The Activity tab shows the selected domain's connected users if they are connected through FTP or SFTP protocol. The user list is updated in real-time with a delay of some seconds. The details of each connection include the user ID, session ID, username, IP, connection time, and the last FTP or SFTP command executed.
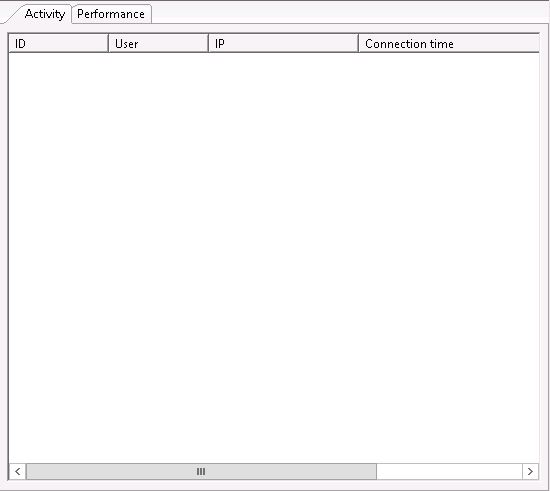
Activity tab displays the information with the following columns:
ID
Displays the user's session ID.
User
Displays the name of the user connected.
IP
Displays the user's IP address.
Connection time
Displays the during this user is connected. The connection time is in HH:MM format.
Protocol
Displays the file transfer protocol the connection is using. It could be FTP or SFTP. All other stateless protocols are excluded from the Activity tab.
Last command
Displays the last command of this user.
The connection context menu has the following menu items:
Refresh
Refreshes the listing of the active users.
Kick user
Forcefully disconnects the selected user.
Stop transfer
If the connection is in progress of file transfer, this command stops it.
Send message
This command allows you to send a message to the selected user. This feature is only supported in FTP. Also, not all FTP clients support this feature, so there is no guarantee that the user will receive the message.
Performance tab
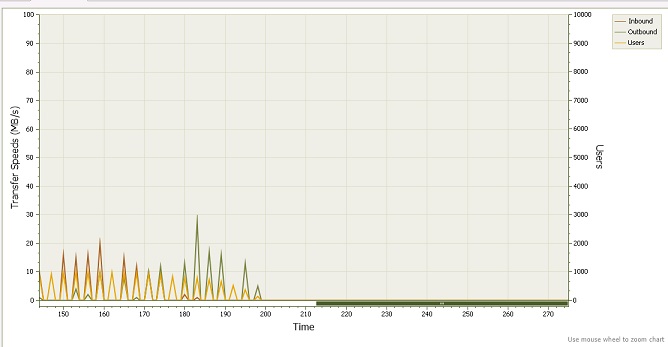
The performance tab shows real-time domain status regarding inbound and outbound traffic and the number of connected users. The vertical axis on the left shows the total transfer speeds, with upload and download (inbound and outbound) in different colors. The vertical axis on the right shows the number of concurrently connected users. The horizontal axis shows the time elapsed. You can pan the graph with the mouse to see statistics at different times. Please maximize the management console window to better view the performance graph.